Chapter 1 Data is everywhere
Data is ubiquitous in today's world and its importance is growing rapidly, especially in social science. With the increasing availability of data, researchers can gain insights into human behavior, social trends, and other important phenomena. The use of data analysis tools and techniques allows researchers to extract meaningful insights from the vast amounts of data that are being generated every day, and these insights can be used to inform policies, strategies, and decisions that impact society. It is therefore crucial for social scientists to have the skills and knowledge to effectively manage and analyze data.
1.1 Why we measure
Two true stories.
1.1.1 Women are having far fewer children.
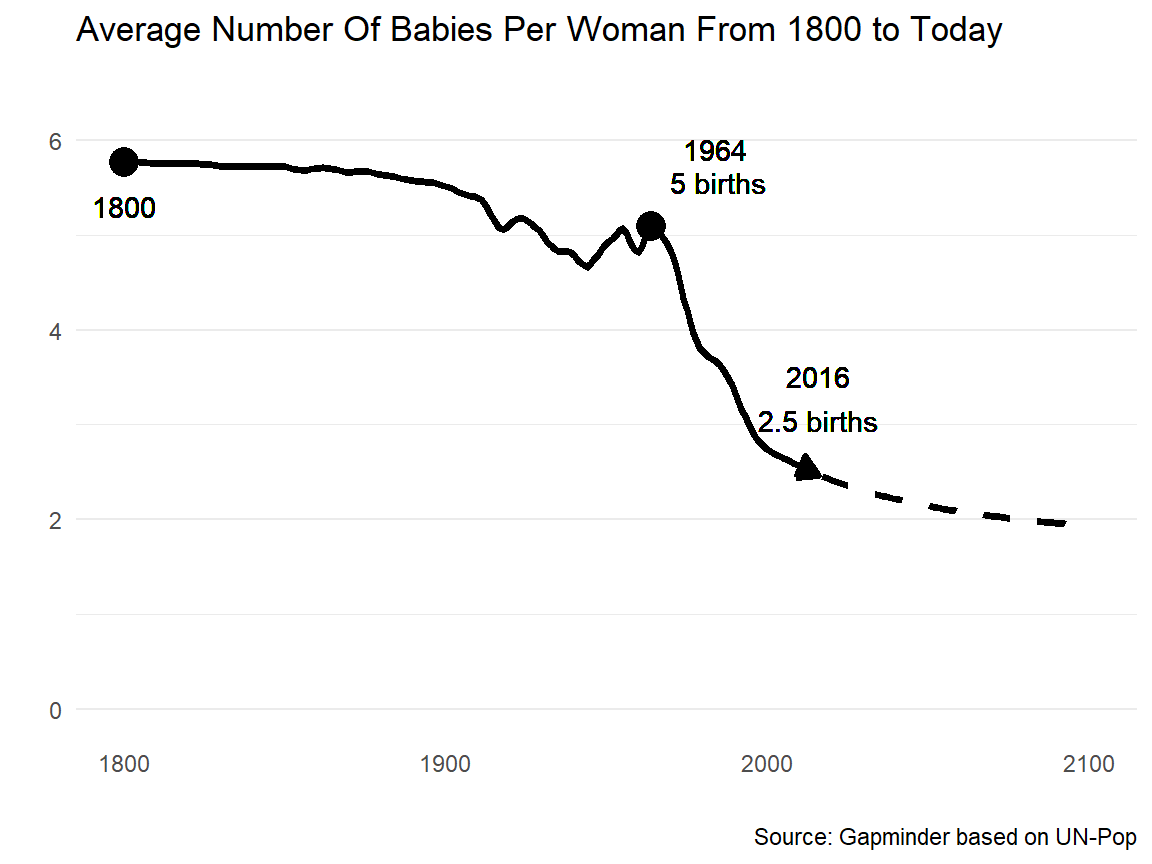
Figure 1.1: Global fertility rate.
Figure 1.1 shows the global total fertility rate according to Gapminder.3 There is a dramatic change in the number of babies per woman in the last 50 years. The maintenance of a stable human population requires that the mean number of children women should have by the completion of the fertile part of their life is 2.1.4
We cannot know this without measurement. We may have an impression that families are smaller, but that could just be the people we know directly – and most of us know directly at most a couple of hundred households.5 We have to measure to know the big picture and we have to keep measuring to see how the picture is changing. Size matters. Change matters. Without measurement we can describe neither current condition nor the history of current condition.
1.1.2 Global surface temperature is rising.
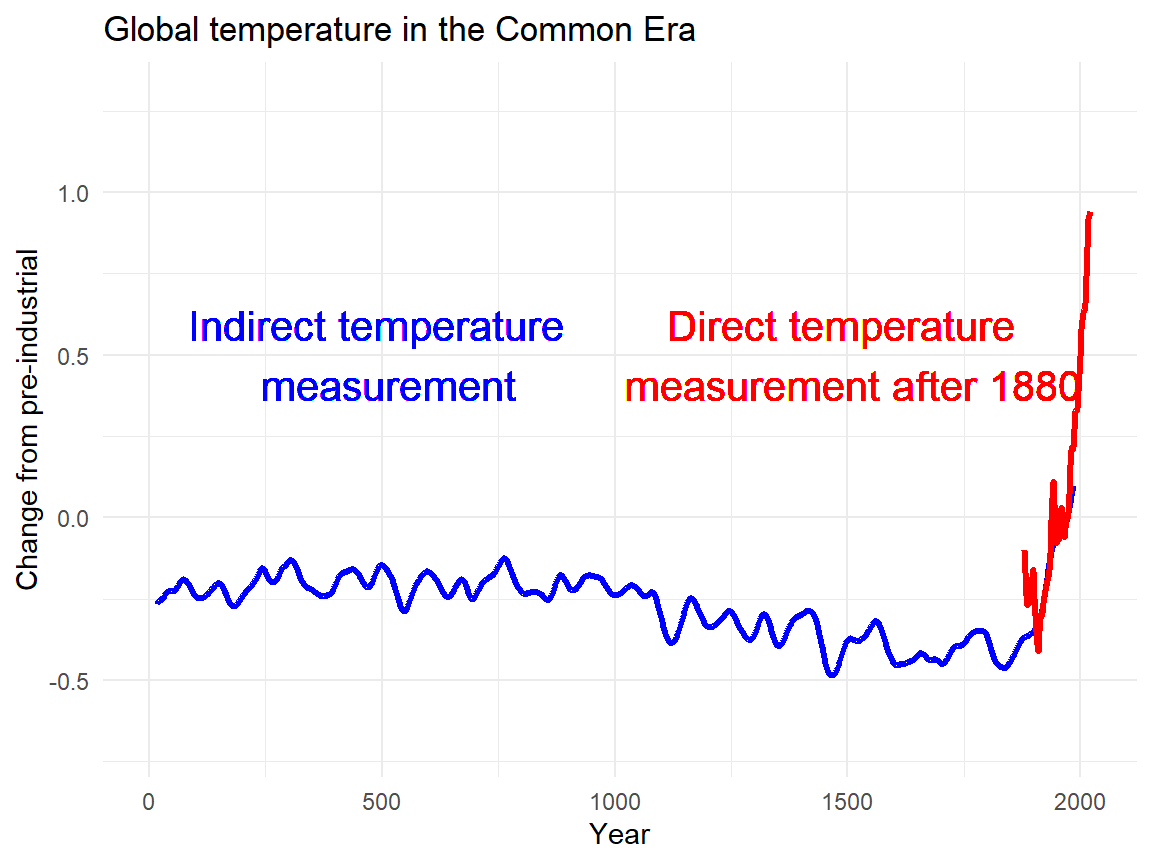
Figure 1.2: Global temperature in the common era.
The 2011–2020 decade warmed to an average 1.09 °C [0.95–1.20 °C] compared to the pre-industrial baseline (1850–1900). Figure 1.2 shows a global surface temperature reconstruction over the last 2000 years using proxy data from tree rings, corals, and ice cores in blue. Directly observed data is in red (Wikipedia contributors 2022).
Data is required to make informed decisions. Decisions about climate change are complex, costly and have long-term implications. It is therefore vital that such decisions are based on the best available evidence. We need to understand the quality and provenance of that evidence, and whether any assumptions have been made in generating it.
1.2 Means of measuring
Data collection is the process of gathering and measuring information. As social scientists we rarely count tree rings or analyse corals and ice cores. Social science is concerned about human behavior, attitudes, opinions, and characteristics to understand social phenomena. Social science researchers use a variety of data collection methods, including surveys, interviews, observations, and experiments, to collect data that can be analyzed and used to test hypotheses and answer research questions.
Surveys are a common data collection method in social science research. They involve administering questionnaires to a sample of individuals to collect data about their attitudes, opinions, beliefs, and behaviors. Surveys can be conducted through various means, including online, telephone, and face-to-face interviews.
Interviews are another method used in social science research to collect data. Interviews involve asking individuals questions about their experiences, attitudes, and opinions in a one-on-one or group setting. Interviews can be structured, semi-structured, or unstructured, depending on the research question.
Observations are a method used to collect data about human behavior by observing individuals in natural or controlled settings. Researchers can collect data through direct observation or by using technology to capture behavior, such as video or audio recordings.
Experiments involve manipulating one or more variables to observe their effect on a dependent variable. Experiments can be conducted in a controlled laboratory setting or in the natural environment.
Data scraping is a method of data collection that involves using software or code to extract information from websites or other online sources. Data scraping can be a useful tool for gathering large amounts of data quickly, and it can be used for a variety of purposes, including market research, sentiment analysis, and trend analysis.
In social science research, data collection must be conducted ethically and with informed consent from participants. Researchers must also consider issues of bias and sampling to ensure that their data collection methods produce accurate and representative data.
1.3 Types of data
1.3.1 Origin of data
Primary and secondary data are two types of data used in research, and they differ in their origin and collection method.
Primary data is original data that is collected by the researcher or research team through direct observation, experimentation, surveys, interviews, or other methods. Primary data is often collected specifically for the research project at hand, and it is tailored to the research question and objectives. Primary data is generally more expensive and time-consuming to collect compared to secondary data, but it is often more accurate and reliable since the researcher has more control over the data collection process.
Secondary data, on the other hand, is data that has already been collected and compiled by others for other purposes. This can include data from sources such as government reports, academic journals, newspapers, and industry reports. Secondary data can be accessed easily and is usually less expensive and less time-consuming to obtain compared to primary data. However, the accuracy and reliability of secondary data can be a concern, as it may not have been collected with the specific research question or objectives in mind, or it may be outdated or biased.
A lot of data comes ready for analysis and free for research purposes. Make us of it.
1.3.2 Analysis of data
Qualitative and quantitative data are two types of data used in research, and they differ in their nature and analysis methods.
Qualitative data is non-numerical data that is collected through open-ended questions, observations, or other non-structured methods. This data can be text, audio or visual. Qualitative data is often descriptive and subjective, and it provides insight into how individuals perceive and interpret the world. Qualitative data is often analyzed using methods such as thematic analysis, content analysis, or discourse analysis, and it can provide rich and detailed insights into complex phenomena. There are quantitative approaches to analyse text (text mining, e.g. sentiment analysis) and visual data (machine learning, e.g. image classification) as well.
Quantitative data, on the other hand, is numerical data that is collected through structured methods such as surveys or experiments. Quantitative data is often used to test hypotheses and to measure the magnitude and frequency of a particular phenomenon. Quantitative data is analyzed using statistical methods, such as regression analysis or hypothesis testing, and it provides objective and standardized results. That being said, quantitative data is usually expressed in numerical form and can represent size, length, duration, amount, price, and so on.
Sometimes quantitative data is understood as metric continuous as opposed to qualitative data in the form of categorical data.
1.3.3 Structure of data
Rectangular data is a type of data structure that is commonly used to organize and store data in tables or spreadsheets. In rectangular data, the rows represent individual observations or cases, while the columns represent variables or attributes that describe the observations. Each cell in the table represents a single value for a particular observation and variable.
Rectangular data is also known as "tabular data" or "relational data," and it is the most common type of data used in quantitative research. Rectangular data is used to store various types of data, including demographic data, survey responses, financial data, and experimental data.
Two common types of tabular data are cross-sectional and panel data that differ in their nature and the research question they address.
Cross-sectional data is collected at a single point in time, from a sample of individuals, organizations, or other units of analysis. Cross-sectional data provides a snapshot of a particular phenomenon at a specific point in time, and it can be used to analyze differences and similarities between groups. Cross-sectional data can be collected through surveys, experiments, or other methods, and it is often analyzed using descriptive statistics, such as means, medians, or percentages.
Panel data, on the other hand, is longitudinal data that is collected from the same individuals, organizations, or other units of analysis over time. Panel data provides information on how a particular phenomenon changes over time, and it allows for the analysis of individual-level changes and the identification of causal relationships. Panel data can be collected through surveys, experiments, or other methods, and it is often analyzed using methods such as regression analysis or difference-in-differences.
1.3.4 The level of access
Open data refers to data that is made available to the public without restrictions or limitations on its use, reuse, and redistribution. This means that anyone can access, use, and share the data without needing permission or paying fees.
One example is the official portal for European data is called the European Data Portal (EDP). It is a comprehensive platform that provides access to public datasets from various European Union (EU) institutions and other sources. The EDP aims to promote the sharing and use of open data across Europe by offering a centralized platform for finding, accessing, and using data.
Open data is licensed under an open license. An open license is a type of license that allows others to access, use, and share a work or product while also providing certain freedoms and protections to the creator or owner of the work. Open licenses are often used for software, content, and data, and they typically include conditions that allow for free distribution and modification of the work.
The statistical office in Germany provides open data under the Data Licence Germany 2.0.
Most Wikipedia texsts are licensed under Creative Commons Attribution-ShareAlike 3.0. The Creative Commons Attribution-ShareAlike 3.0 (CC BY-SA 3.0) license is a type of open license that allows others to share and adapt a work, as long as they give credit to the original creator and distribute any derivative works under the same or a similar license.
1.4 Can we measure everything?
In order to conduct meaningful measurement we need to make sure that we have a good understanding about the concept in question and its units of measurement. Some concepts are easy to grasp and there is a broad consensus on how to measure them.
Remember Figure 1.2 that shows a global surface temperature. Temperature can be measured in Celsius or Fahrenheit (SI units). There is an accepted translation between the Celsius and Fahrenheit, i.e. 0°C correspond to 32°F and 0°F correspond to -17.8°C. We have a good understanding of what 10°C means and even know how 10°C "feels". Still, sometimes (or most of the time?) we just don't have the data we like to have. Thus the graph shows a temperature reconstruction using indirect proxy data from tree rings, corals, and ice cores as well as directly observed data (when available).
Definition
Variables are manifest or observed when they are directly measurable or hidden or latent when they are "idealized constructs at best only indirectly measurable".
The number of Twitter follower at a given time is technically determined and can be counted. It is a natural number. Age is indisputable measured in years but it could also be measured in month or days. For most analytically purposes years will be fine. Exact birth dates may not be available due to data protection aspects.
Some concepts are harder to grasp and require a specific argument. Think about intelligence, populism, happiness or humor. What exactly are they and how can they be measured?
Definition
Operationalization means turning abstract concepts into measurable observations. It involves clearly defining your variables and indicators.6
See this joke:
Q: “What’s the difference between England and a tea bag? “
A: “The tea bag stays in the cup longer.”
What would be the best way of measuring how funny the joke is? We could measure physiological responses to jokes, such as heart rate, respiration rate, or facial expressions. Researchers may use brain imaging techniques, such as functional magnetic resonance imaging (fMRI), to measure brain activity in response to jokes. Many times, for many analytically purposes this will be an overkill. It will be expensive in terms of money and time. Thus most of the time, we ask people how funny they rate this joke on a scale from 1 to 10 where 1 refers to "not at all funny" and 10 refers to "extremely funny"?
It is tempting to measure all social phenomena on a scale from 1 to 10.
Wechsler Adult Intelligence Scale (version IV, released 2008) measures intelligence. Scores from intelligence tests are estimates of intelligence. Unlike, for example, distance and mass, a concrete measure of intelligence cannot be achieved given the abstract nature of the concept of "intelligence".
Once measured, concepts can be related to each other:
- What is the relation between age and Twitter usage? (See chapter Relationships)
- What is the effect of intelligence on happiness? (See chapter Regression)
1.5 The reality behind the data
... it is important not to lose sight of the individuals whose lives provide the data for the models. Although variables rather than individual people may become the subjects of the statistician’s narrative, it is individuals rather than variables who have the capacity to act and reflect on society.
Sometimes, statisticians may become so focused on the data and the patterns they observe that they forget about the individuals behind the data. But it's important to keep in mind that it is ultimately individuals who are affected by the decisions and policies that are informed by the data. People have the ability to act and reflect on society, and understanding their experiences and perspectives is critical to building models and making decisions that truly reflect the needs and values of society as a whole.
Data from 1800 to 1950 comes from Gapminder v6, for 1950 to 2014 from UN estimates and 2015 to 2099 from UN forecasts of future fertility.↩︎
It is 2.1 rather than 2 to allow for the failure of some female children themselves to live through the fertile years of adult life.↩︎
According to Tian Zheng (Columbia College), the average American knows about 600 people. NY times https://www.nytimes.com/2013/02/19/science/the-average-american-knows-how-many-people.html↩︎
Read more: https://www.scribbr.com/methodology/operationalization/↩︎