About the book
I welcome you to join us on our way to become fluent in data.
Aims of this book
This project is for everyone.
For students
You go from zero you hero in data analysis and data science and will become data fluent and learn major skills that you can use in your academic and business career.
The ability to take data — to be able to understand it, to process it, to extract value from it, to visualize it, to communicate it — that’s going to be a hugely important skill in the next decades...
In addition and independent of a specific career, I would like to foster people's data literacy.
Definition
Data literacy is the ability to read, understand, create, and communicate data as information.
I would like to enable and empower all people to understand the data work of others. Don't take numbers for granted. It's a long journey to get them. Don't be satisfied with a summary or conclusion from someone else. It's worthwhile checking data sources and data work. Either to replicate and validate the data work of others or to form your own opinion.
Not to mention, coding is fun.
You might be under the impression, to code, your favorite thing must be computers. Or I've heard I'm bad a math, I can't code. None of this is true. Think about it, what is your passion.
Learn to code, is something that you can do. And something that may just expand the way you approach and think about the passions in your life. Be their personal or professional.

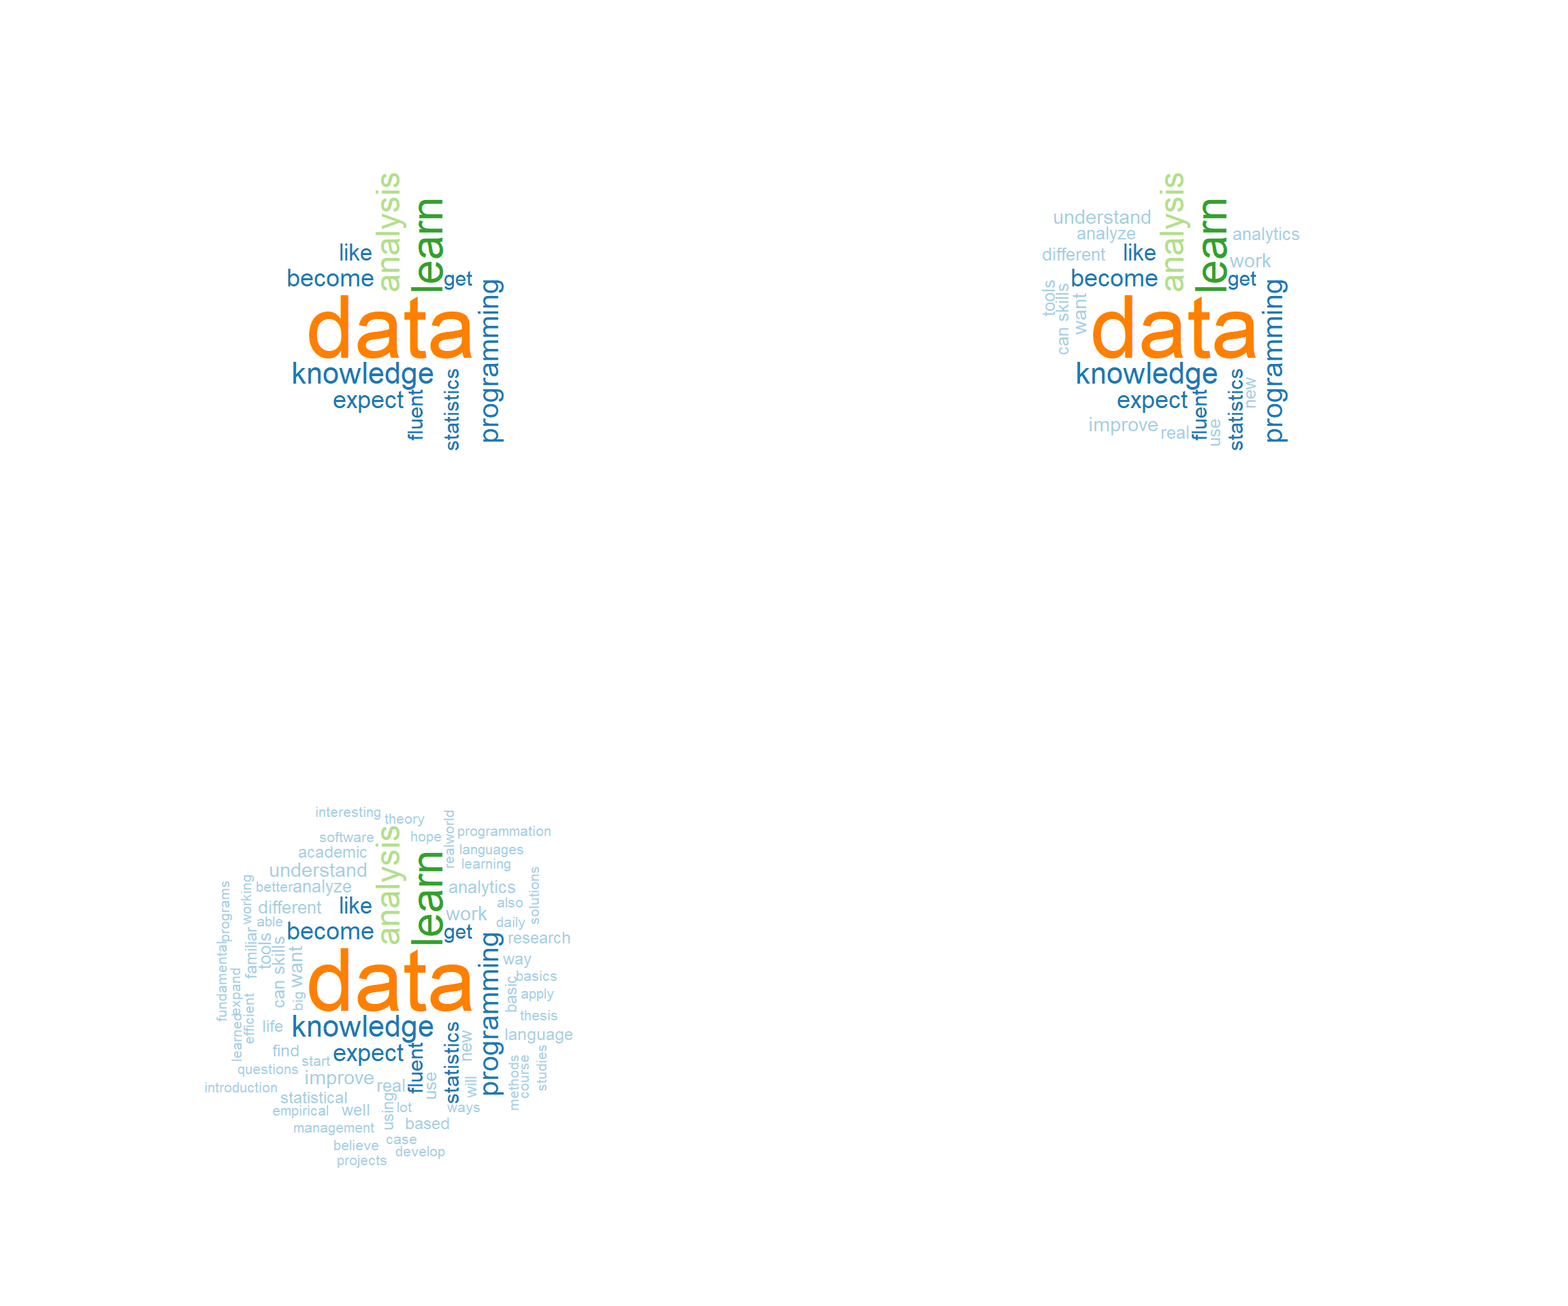
A wordcloud of 25 students answers (2020) on the question: What do you expect to learn in this seminar?
The animation is created by the gifski package.
For instructors
Becoming Fluent In Data is planned to become an open educational resource (OER) and provide freely accessible educational content related to data analysis. It offers resources, tutorials, and information aimed at helping individuals become proficient in working with data. As an OER, the website allows users to access and utilize its materials without any cost, enabling widespread dissemination and promoting equitable access to knowledge and learning opportunities.
The licensing is yet to be finalized.
Parts of the OER can be used flexibly, as they are modular and can be used independently of each other. This enables users to select and use those parts that are relevant to their specific needs. They can extract individual chapters, modules or exercises from the OER resource and integrate them into their own learning environments.
The site is hosted on GitHub, the entire source code is available.
The project is accompanied by a data repository that can be used for a variety of teaching and learning scenarios (available as .txt, .csv or .xlsx).
The educational videos created for the OER can be used as a standalone introduction to central concepts.
Structure
Every chapter covers the content of a week.
The first half of the course introduces all the data basics from scratch. What is data? Why do we measure? How do we measure? How do we make comparisons?
Most decisions are complex, costly and have long-term implications. It is therefore vital that such decisions are based on the best available evidence.
The second half of the course focuses on the analysis of relationships. The most interesting research questions in social science are about relationships. What is the relationship between beauty and employment chances? What is the connection between money and happiness? How does remote work change ones productivity? Is social support related to longevity of marriages?
The workhorse procedure is regression, a statistical technique that relates variables to each other.
Color
Colored paragraphs give you a visual overview of things to watch out:
Definition
A definition is a statement of the meaning of a term.
Amazing Fact
Bazinga highlights a memorable fact.
Reading
A precious resource.
Your Turn
It's your turn.
Truly Dedicated
Heavy stuff to think about.
Components
The tippy package allows underlined text to display tooltips.
The webexercises package allows interactive web pages that you can use in . What is the Answer to the Ultimate Question of Life .
The most powerful interaction comes from the web annotation tool https://web.hypothes.is/. You may annotate or highlight all text by selecting it with the cursor and then click the on the pop-up menu. You can also see the annotations of others: click the in the upper right hand corner of the page. Create a free account for this feature.
Why R?
This book uses R. All concepts could have been implemented in Python as well and there is a future plan to translate some examples to Python. Both are versatile programming languages with an active community and a lot of free online resources.
My main recommendation is to use a programming language instead of a WYSIWYG statistical software (e.g. SPSS) and to use open-source software instead of proprietary software.
Why Tidyverse?
The debate regarding how to teach R centers around whether to introduce the base R programming language or the tidyverse ecosystem. Proponents of base R argue that it provides a solid foundation for understanding R's core principles and functions. It emphasizes learning the fundamentals of R programming, which can be beneficial for more complex data manipulation tasks and working with large datasets.
On the other hand, advocates for the tidyverse approach argue that it offers a more user-friendly and intuitive way to work with data. The tidyverse packages, such as dplyr and ggplot2, provide a consistent and streamlined syntax for data manipulation and visualization, making it easier for beginners to grasp and apply data analysis techniques.
This book uses tidyverse predominantly.